The tech world is currently buzzing about Factify, a startup that just raised $63 million to "kill the PDF." Their premise is sound: the PDF is a digital fossil—a static, "dumb" snapshot of data that cannot be queried, verified, or easily updated. They want to replace it with a live, interactive document format.
At Code On Time, we understand this frustration better than most. But we believe the solution isn't to reinvent the file format. The solution is to reinvent the worker that creates it.
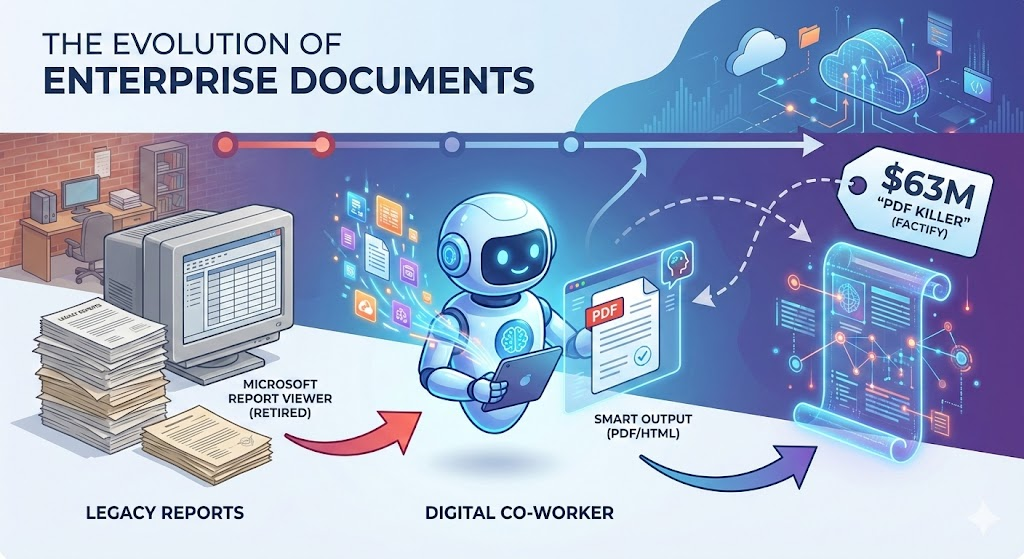
In fact, the architecture of our Digital Co-Worker wasn't originally designed to compete with AI agents. It was born from a much more pragmatic necessity: we needed to replace the retired Microsoft Report Viewer.
The Legacy: The Era of the `.rdlc`
For years, the gold standard for enterprise reporting in the .NET ecosystem was the Microsoft Report Viewer. If you have built applications with Code On Time, you know the drill. You would open Visual Studio, meticulously design an `.rdlc` file, and deploy it.
Under the hood, our framework did the heavy lifting. We had a robust engine (which still powers thousands of apps today) that would take an incoming request, hydrate a `DataTable` from your Data Controller, and force-feed it into the report definition to spit out a PDF.
It looked something like this:
// The "Old Guard" of Report Generation
void IHttpHandler.ProcessRequest(HttpContext context)
{
    // 1. Decrypt the request
    var request = JsonConvert.DeserializeObject<PageRequest>(q);

    // 2. Execute the Data Controller (The "Business Logic")
    var page = ControllerFactory.CreateDataController().GetPage(request.Controller, request.View, request);
    var table = page.ToDataTable();

    // 3. Load the hard-coded .rdlc definition
    var reportTemplate = Controller.CreateReportInstance(null, templateName, ...);

    // 4. Render the PDF
    var report = Render(request, table, reportTemplate, "Pdf");

    // 5. Stream it to the user
    context.Response.OutputStream.Write(report.Data, 0, report.Data.Length);
}
This code works. It is reliable. But it is rigid. The "intelligence" is frozen in the compiled code and the static `.rdlc` layout. If a customer wanted a slightly different invoice format, or if they wanted to summarize the data differently, a developer had to open Visual Studio and redeploy the app.
When Microsoft effectively retired the Report Viewer technology, we faced a choice: Do we build another rigid reporting engine, or do we leap forward?
The Shift: From "Report Viewer" to "Digital Co-Worker"
We realized that the problem wasn't the PDF format itself. The PDF is fine as a final output. The problem was the process of generating it.
We didn't need a better renderer; we needed an entity that could understand the data and compose the document, just like a human employee would.
This led to the birth of the Digital Co-Worker.
Instead of a static .rdlc file, the Digital Co-Worker uses `.ai` files—canned prompts that describe the task. And instead of binding tightly to a raw `DataTable`, it interacts with our Level 3 HATEOAS API.
How It Works: The "Factify" Implementation
While Factify is trying to build a "smart document" infrastructure from scratch, Code On Time developers already have the infrastructure to generate smart documents today.
- The Prompt (`.ai`): You define a "canned" prompt. For example: "Generate an invoice for Order #1024 using the 'Professional' HTML template."
- The Agent: The Digital Co-Worker picks up this task. It doesn't query the database directly (which bypasses security). It uses the HATEOAS API to "surf" your data, respecting all access control rules, just like the old `ProcessRequest` method did, but dynamically.
- The Merge: The Co-Worker takes the structured JSON data it retrieved and merges it into a standard user-provided HTML template.
- The Output: The result is a perfect PDF, an HTML email, or even a text summary.
The Future is "Canned" Intelligence
The next generation of Code On Time will lean heavily into this model. We are enabling the use of "canned" prompts in `.ai` files that act as the new "Report Definitions."
Imagine a scenario where your application needs to send a dunning letter to a customer.
- Old Way: You design a specific `.rdlc` report for "Overdue Notices."
- New Way: You have a `.ai` file with a prompt: "Review the customer's payment history. If they are >60 days overdue, generate a polite but firm PDF letter using the 'Urgent' template and email it to the billing contact."
The Digital Co-Worker does the work. It "factifies" the data by pulling it from the source of truth (the app), processing it through the prompt, and stamping it into a PDF.
Here is the new section titled "Practical Implementation: The .ai Report". You can insert this into the blog post draft immediately preceding the Conclusion.
Practical Implementation: The `.ai` Report
How does this work in the real world? In the legacy era, a developer would spend hours in Visual Studio designing a layout. In the Digital Co-Worker era, they simply write a text file.
Let's look at a concrete example: `report1.ai`.
This file acts as the "Source Code" for the report. However, unlike a script, it is not executed line-by-line by a compiler. It is interpreted by the Digital Co-Worker's State Machine.
The "State to Keep" Architecture
When the Digital Co-Worker wakes up to generate this report, it does not browse the public internet. It is hermetically sealed within your application's security perimeter.
It looks at two things to decide what to do next:
- The HATEOAS Resource: The current JSON response from your application (the "page" it is currently on).
- The State Array (state_to_keep): A memory log that persists across server requests.
The `state_to_keep` array initializes with the content of your .ai file as the first item:
`["Goal: Generate Inventory Report (report1.ai)", "<universal system instruction for LLM how to navigate>", ...]`
The Co-Worker reads the prompt in the first slot, realizes it needs product data, examines the current HATEOAS links, and "clicks" the transition to the data source (e.g., the `products` endpoint). Once the data is loaded into its context, it executes the final generation step.
The Prompt (`report1.ai`)
Here is the actual prompt used to generate the report. Notice how it defines logic (calculate averages), styling (zebra stripes), and behavior (print-to-pdf) in natural language.
Act as a Front-End Developer and Data Analyst. Create a standalone HTML5/CSS3 file that generates a Product Inventory Report based on a hardcoded JSON array.

1. Data & Logic Requirements:
   Dataset: Use a collection array containing: Product Name, Category, Supplier, and Unit Price.
   Exclusions: Do not display any unique IDs or internal metadata.
   Calculation: Write a JavaScript function to calculate the average unitPrice of all items in the array.
   Conditional Formatting: Automatically apply a specific CSS class to any unitPrice that is above the calculated average, rendering that specific text in Bold Red.

2. Visual & UI Design:
   Typography: Use a clean, professional sans-serif font stack (e.g., Segoe UI or Roboto).
   Layout: Use a wide table layout with a clear visual hierarchy.
   Styling:
   * Include Zebra-striping (alternating row colors) for readability.
   * Right-align all currency values to ensure decimal alignment.
   * Create a professional header with a border-bottom and a summary bar displaying the calculated average.
   * Add a 'Total' footer row at the bottom of the table with a distinct background color.

3. Functionality & Print Specs:
   Print Button: Include a 'Print to PDF' button at the top of the report.
   Print CSS: Use @media print rules to:
   * Hide the 'Print' button during printing.
   * Ensure background colors (zebra stripes) and red text highlights are preserved using -webkit-print-color-adjust: exact;.
   * Self-Contained: All CSS must be in a <style> tag and all JS in a <script> tag within a single HTML file.

Take the data for the report at https://demo.codeontime.com/v2/public/products
Note: The final line in the prompt above (`Take the data for the report at…`) is included here only so you can test this prompt yourself in ChatGPT or Gemini. This line is not needed when the prompt is sent to the Digital Co-Worker.
In a real deployment, the Digital Co-Worker navigates the data as an alter-ego of the current user. It does not need a public URL; it autonomously traverses your application's secure HATEOAS API, collects the necessary data records based on the user's permissions, and injects them directly into the context. The Co-Worker then performs the logic and produces the final HTML output on its own.
The Result
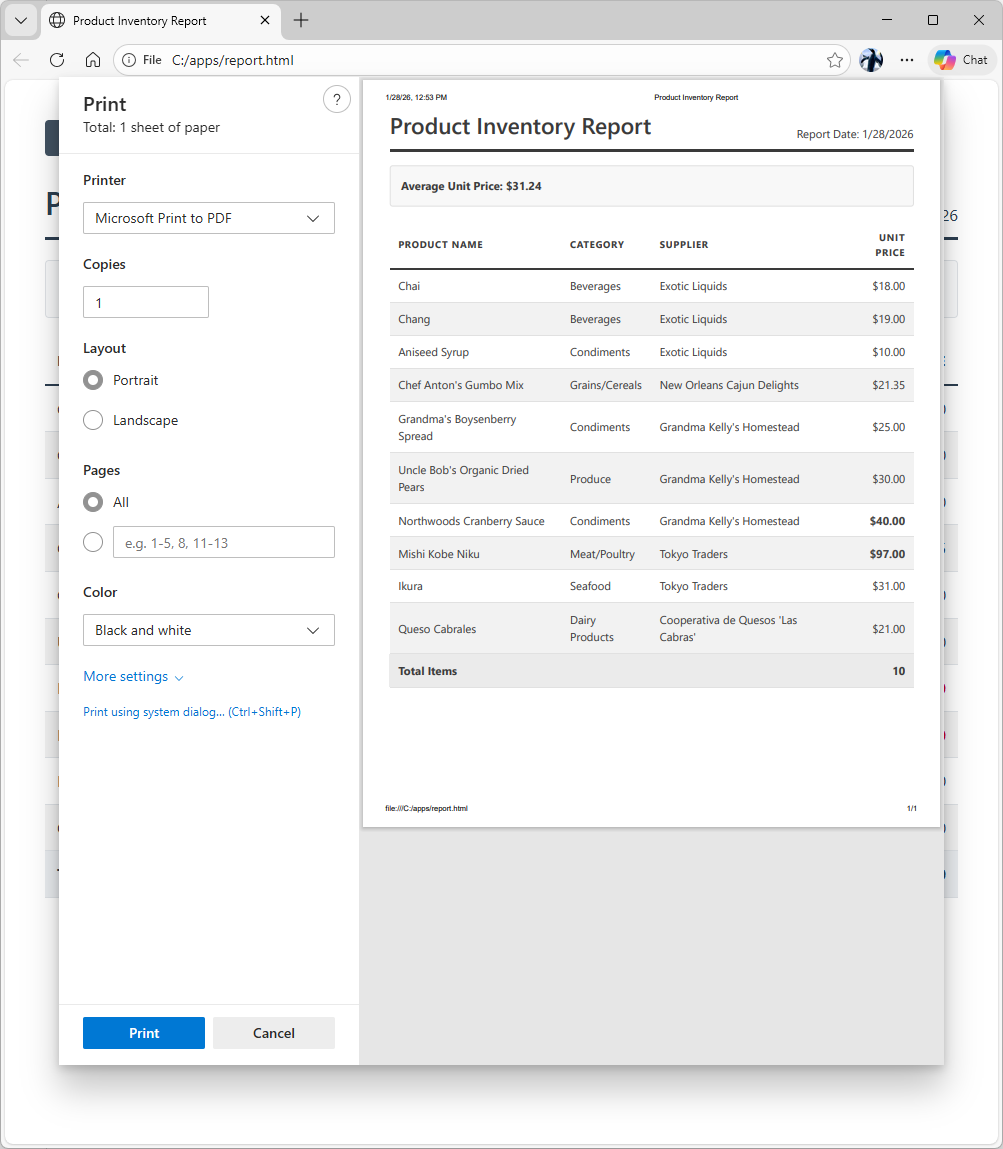
The Co-Worker produces a single, self-contained HTML string. It executes the Javascript to calculate averages on the fly and renders a clean, print-ready interface.
The user doesn't see a "file download." They see a standard HTML page rendered instantly in their browser. When they click Print to PDF, the browser's native engine handles the serialization, preserving the "Red Bold" high-value items exactly as requested.
This is the definition of "Factify" realized: Live data + Intelligent Logic + Standard Output. No proprietary viewers required.
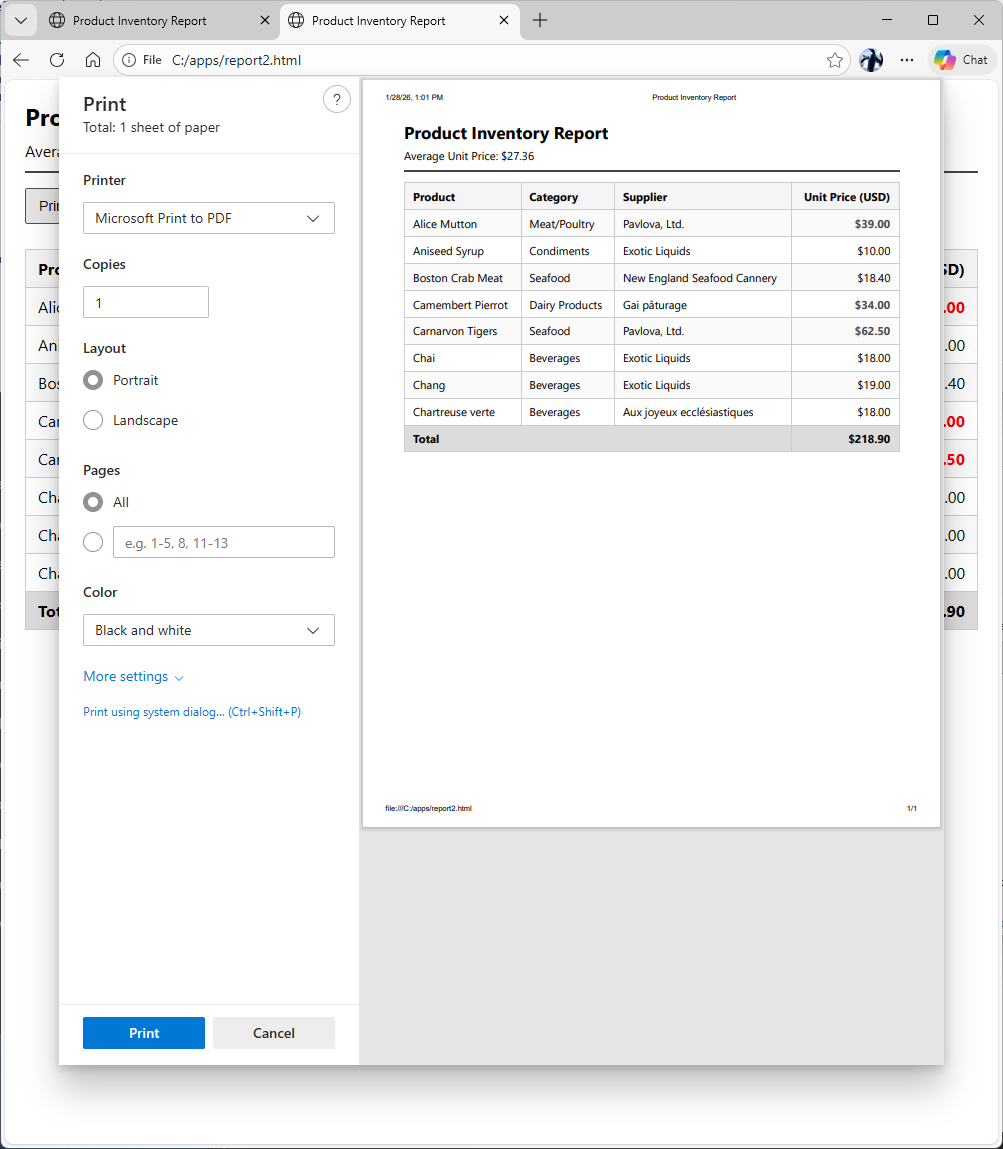
This is the visualization of prompt output produced by the Chat GPT.
This is the script generated by Fast Gemini to implement the report.
<!DOCTYPE html>
<html lang="en">
<head>
    <meta charset="UTF-8">
    <meta name="viewport" content="width=device-width, initial-scale=1.0">
    <title>Product Inventory Report</title>
    <style>
        /* 2. Visual & UI Design */
        :root {
            --primary-color: #2c3e50;
            --accent-color: #f8f9fa;
            --border-color: #dee2e6;
            --highlight-color: #d0021b;
            --zebra-color: #f2f2f2;
            --footer-bg: #e9ecef;
        }

        body {
            font-family: 'Segoe UI', Roboto, Helvetica, Arial, sans-serif;
            color: var(--primary-color);
            line-height: 1.6;
            margin: 40px;
            background-color: #fff;
        }

        .report-container {
            max-width: 1000px;
            margin: 0 auto;
        }

        header {
            border-bottom: 3px solid var(--primary-color);
            margin-bottom: 20px;
            padding-bottom: 10px;
            display: flex;
            justify-content: space-between;
            align-items: flex-end;
        }

        h1 { margin: 0; font-weight: 600; }

        .summary-bar {
            background: var(--accent-color);
            padding: 15px;
            border-radius: 4px;
            margin-bottom: 20px;
            border: 1px solid var(--border-color);
            font-weight: bold;
        }

        /* Table Styling */
        table {
            width: 100%;
            border-collapse: collapse;
            margin-bottom: 30px;
        }

        th {
            background-color: #fff;
            text-align: left;
            padding: 12px;
            border-bottom: 2px solid var(--primary-color);
            text-transform: uppercase;
            font-size: 0.85rem;
            letter-spacing: 1px;
        }

        td {
            padding: 10px 12px;
            border-bottom: 1px solid var(--border-color);
        }

        /* Zebra-striping */
        tbody tr:nth-child(even) {
            background-color: var(--zebra-color);
        }

        /* Alignment and Formatting */
        .text-right { text-align: right; }

        /* Conditional Formatting Class */
        .above-average {
            color: var(--highlight-color);
            font-weight: bold;
        }

        .footer-row {
            background-color: var(--footer-bg) !important;
            font-weight: bold;
        }

        /* Button Styling */
        #print-btn {
            background-color: var(--primary-color);
            color: white;
            border: none;
            padding: 10px 20px;
            border-radius: 4px;
            cursor: pointer;
            margin-bottom: 20px;
            font-size: 14px;
            transition: opacity 0.2s;
        }

        #print-btn:hover { opacity: 0.9; }

        /* 3. Print Specs */
        @media print {
            #print-btn { display: none; }
            body { margin: 0; }
            .report-container { width: 100%; max-width: none; }

            * {
                -webkit-print-color-adjust: exact !important;
                print-color-adjust: exact !important;
            }
        }
    </style>
</head>
<body>

    <div class="report-container">
        <button id="print-btn" onclick="window.print()">Print to PDF</button>

        <header>
            <h1>Product Inventory Report</h1>
            <div id="report-date"></div>
        </header>

        <div class="summary-bar" id="summary-bar">
            Calculating Average...
        </div>

        <table id="inventory-table">
            <thead>
                <tr>
                    <th>Product Name</th>
                    <th>Category</th>
                    <th>Supplier</th>
                    <th class="text-right">Unit Price</th>
                </tr>
            </thead>
            <tbody id="inventory-body">
                </tbody>
            <tfoot>
                <tr class="footer-row" id="footer-row">
                    <td colspan="3">Total Items</td>
                    <td id="total-count" class="text-right">0</td>
                </tr>
            </tfoot>
        </table>
    </div>

    <script>
        // 1. Data Requirements (Sampled from the requested demo link)
        const inventoryData = [
            { ProductName: "Chai", Category: "Beverages", Supplier: "Exotic Liquids", UnitPrice: 18.00 },
            { ProductName: "Chang", Category: "Beverages", Supplier: "Exotic Liquids", UnitPrice: 19.00 },
            { ProductName: "Aniseed Syrup", Category: "Condiments", Supplier: "Exotic Liquids", UnitPrice: 10.00 },
            { ProductName: "Chef Anton's Gumbo Mix", Category: "Grains/Cereals", Supplier: "New Orleans Cajun Delights", UnitPrice: 21.35 },
            { ProductName: "Grandma's Boysenberry Spread", Category: "Condiments", Supplier: "Grandma Kelly's Homestead", UnitPrice: 25.00 },
            { ProductName: "Uncle Bob's Organic Dried Pears", Category: "Produce", Supplier: "Grandma Kelly's Homestead", UnitPrice: 30.00 },
            { ProductName: "Northwoods Cranberry Sauce", Category: "Condiments", Supplier: "Grandma Kelly's Homestead", UnitPrice: 40.00 },
            { ProductName: "Mishi Kobe Niku", Category: "Meat/Poultry", Supplier: "Tokyo Traders", UnitPrice: 97.00 },
            { ProductName: "Ikura", Category: "Seafood", Supplier: "Tokyo Traders", UnitPrice: 31.00 },
            { ProductName: "Queso Cabrales", Category: "Dairy Products", Supplier: "Cooperativa de Quesos 'Las Cabras'", UnitPrice: 21.00 }
        ];

        function generateReport() {
            const tbody = document.getElementById('inventory-body');
            const summaryBar = document.getElementById('summary-bar');
            const totalCount = document.getElementById('total-count');
            const dateDisplay = document.getElementById('report-date');

            // Set Date
            dateDisplay.innerText = `Report Date: ${new Date().toLocaleDateString()}`;

            // Calculation Logic: Average Unit Price
            const totalSum = inventoryData.reduce((acc, item) => acc + item.UnitPrice, 0);
            const averagePrice = totalSum / inventoryData.length;

            // Update Summary
            summaryBar.innerHTML = `Average Unit Price: $${averagePrice.toFixed(2)}`;
            totalCount.innerText = inventoryData.length;

            // Render Rows
            inventoryData.forEach(item => {
                const row = document.createElement('tr');

                // Conditional Formatting Logic
                const priceClass = item.UnitPrice > averagePrice ? 'above-average' : '';

                row.innerHTML = `
                    <td>${item.ProductName}</td>
                    <td>${item.Category}</td>
                    <td>${item.Supplier}</td>
                    <td class="text-right ${priceClass}">$${item.UnitPrice.toFixed(2)}</td>
                `;
                tbody.appendChild(row);
            });
        }

        // Initialize
        document.addEventListener('DOMContentLoaded', generateReport);
    </script>
</body>
</html>
Conclusion
Factify is raising millions to solve the problem of "dumb documents." At Code On Time, we are solving it by giving you a "smart employee."
You don't need to replace the PDF. You just need to stop hard-coding how it's made. By moving from the Report Viewer to the Digital Co-Worker, you aren't just generating reports; you are deploying an autonomous agent that understands your business data and can present it in any format the world requires.
The legacy code is still there—it still works—but the future is already here.